Categories
Statistics Statistics in the media

Most developers have never seen a successful project

Most developers have never seen a successful project

Is this bad science?  Since this is a retrospective study, there is non-random assignment for the treatment and control groups.  That introduces selection bias.  Projects that are more likely to implement a (long-winded) “waterfall” life-cycle approach are probably larger scale projects to begin with.  Correlation is not causation.  So, maybe it’s not the lifecycle approach that is the problem, but the confounding/lurking variable of project scale that is the problem.  The study should control for the size of the project to make a valid conclusion about success rate of the development approach used.  ie:  Building a large insurance processing system will use a lifecycle approach, while building a fitness app will not.  Apples to oranges, since one is much easier to be implement than the other.
Categories
Education Statistics in the media

Stats 101: Comparing Countries’ Education (yet not controlling for variables)

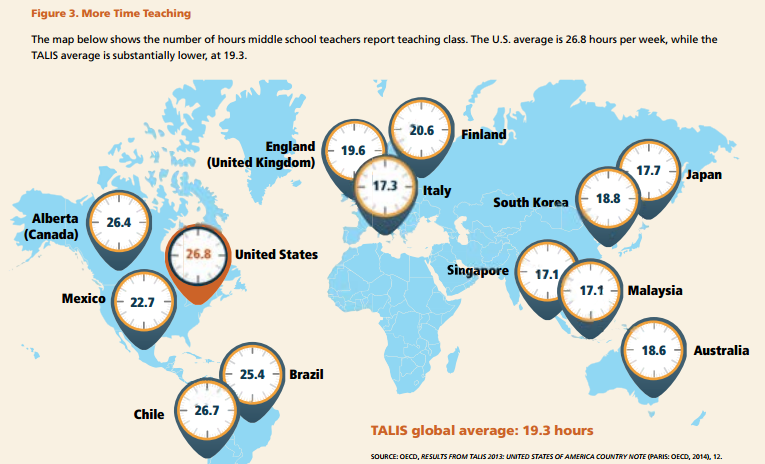
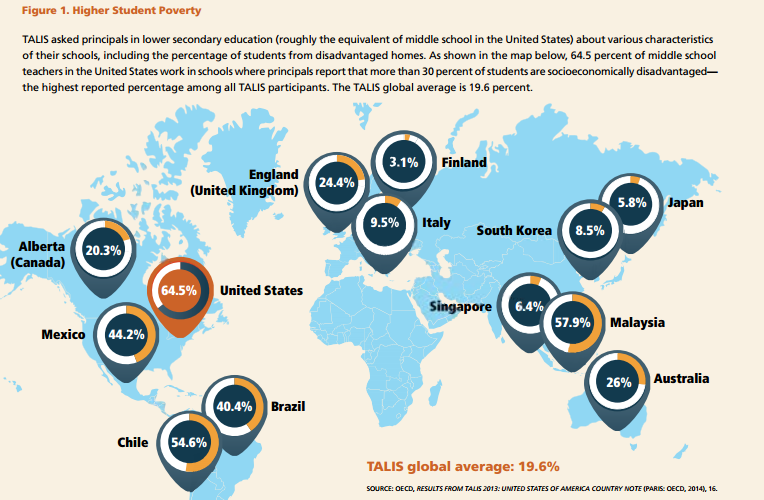
When comparing test scores of different countries, you need to control for variables.  This is basic statistical illiteracy.  Vastly different Student income and teacher workload are 2 factors are never mentioneds

Want to close the achievement gap?  Close the teaching gap


Categories
Education Statistics in the media

Debunked: Singapore’s High Test Scores

Misidentifying Factors Underlying Singapore’s High Test Scores

  • Singapore’s student population does not include the children of huge numbers of people who work the lower-paying jobs in Singapore.
  • For Singaporean students, school is their job; other activities are absent or relegated to minor roles.
  • Most Singaporean children get additional schooling beyond the school day through individual tutoring or classes.  (One survey found 97% of Singaporean students get private Math tutoring)
Yet again, Statistics 101.  Yet this myth is parroted like gospel.  Of course test scores are going to vary when you are not comparing similar groups:  
  • China scores only include children from Shanghai.  (How about we only include students from Scarsdale in the USA TIMMS scores?)
  • Singapore schools do not contain any children from working class families (Service workers commute to Singapore from Malaysia).  Singapore GDP is 50% higher than the USA’s.
  • American students are involved with a wide array of sports and activities.  22% of American students have after school jobs.
  • The reality is that top performing students in affluent suburbs of America perform on par with top performing countries who do not have lower class students in their results.
Categories
Statistics in the media

Incorrectly Comparing Student Test Scores of Various Countries

…97 percent of all Singaporean students, nearly 90 percent of South Korean primary students and about 85 percent of Hong Kong senior secondary students receive tutoring.
Tutoring Spreads Beyond Asia’s Wealthy

When comparing test scores of various countries, are they comparing similar samples?  No.  Just one (of many) confounding variable that needs to be controlled for is the amount of private tutoring each group of students receive.

Categories
Statistics in the media

Harvard researchers challenge results of obesity analysis

Weight and mortality

The studies that Flegal did use included many samples of people who were chronically ill, current smokers and elderly, according to Hu. These factors are associated with weight loss and increased mortality.

Categories
Statistics in the media

Hangover Remedy and the Scientific Method

Here’s a quick summary of the challenges of implementing scientific method to test a supposed remedy:

The acid test, however, is in clinical trials, with human beings, and these are complicated. Basically, what you have to do is give a group of people a lot to drink, apply the remedy in question, and then, the next morning, score them on a number of measures in comparison with people who consumed the same amount of alcohol without the remedy. But there are many factors that you have to control for: the sex of the subjects; their general health; their family history; their past experience with alcohol; the type of alcohol you give them; the amount of food and water they consume before, during, and after; and the circumstances under which they drink, among other variables. (Wiese and his colleagues, in their prickly-pear experiment, provided music so that the subjects could dance, as at a party.) Ideally, there should also be a large sample—many subjects.

A FEW TOO MANY
Categories
Statistics in the media

Supply, Demand and Marriage

They appear, for example, to focus more critically on the earnings potential of prospective mates. Because house size is often assumed to be a reliable signal of wealth, a family can enhance its son’s marriage prospects by spending a larger fraction of its income on housing.

For example, when Shang-Jin Wei, an economist at Columbia University, and Xiaobo Zhang of the International Food Policy Research Institute examined the size distribution of Chinese homes, they found that families with sons built houses that were significantly larger than those built by families with daughters, even after controlling for family income and other factors. They also generally found that the higher a city’s male-to-female ratio, the bigger the average house size of families that have sons.

Mr. Wei reports that many families with sons have begun to add a phantom third story to their homes, one that looks normal from the outside but whose interior space remains completely unfinished.

“Marriage brokers are familiar with the tactic,” he reports, “yet many refuse to schedule meetings with a family’s son unless the family house has three stories.”

Supply, Demand and Marriage

Categories
Statistics in the media

Does impatience make us fat?

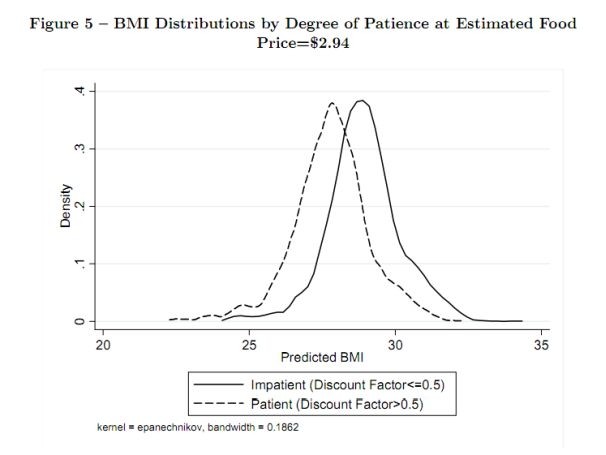
Here is a good example of having to control for variables, in an attempt to best isolate the 2 factors being compared.

They controlled for other factors that might come into play, such as demographics and financial characteristics.

With everything else held constant, the researchers found that impatient individuals are more likely to be obese than people who are good at waiting. “We controlled for basically every variable in the kitchen sink,” says Courtemanche, the lead author and a professor at the University of Louisville. “It seems if you genuinely hold all else constant, the more patient you are, the less you weigh.”


Does impatience make us fat?