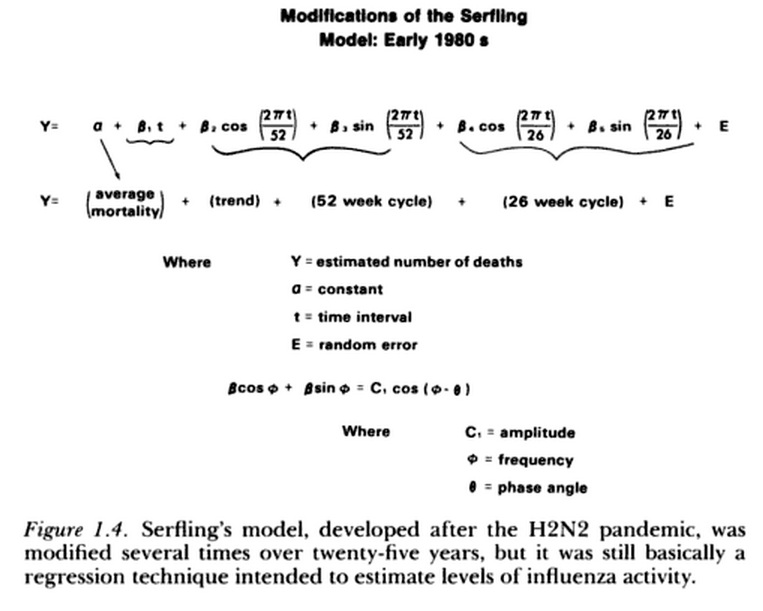

In a nutshell, the sin() and cos() terms are periodic curves, and the weighting of the various coefficients is what allows proper regression fits. Let’s take a closer look at the formula, and try to make sense of it.
As t (weeks) increases to 52, \(\frac{t}{52}\) goes from 0 to 1 (\(\frac{0}{52}\), \(\frac{1}{52}\), \(\frac{2}{52}\), \(\frac{3}{52}\), …, \(\frac{52}{52}\)) Once it goes past 52, it just cycles around again. Recall \(2\pi\) radians = 360 degrees. Since \(\frac{t}{52}\) is multiplied by \(2\pi\), it is multiplying 360 by some number. So, it seems the sin() and cos() terms simply use t weeks to scale across multiples of 360 degrees .
For example, as t goes from 0 to 52, \(\frac{t}{52}\) goes from 0 to 1, \(2\pi * \frac{t}{52}\) goes from 0 and 360. (and then it repeats since sin repeats in multiples of \(2\pi\) and therefore \(sin(2\pi * \frac{t}{52})\) goes from sin(0) to sin(360) which is a full periodic cycle of this function. Note the same logic applies to the cos() term in the formula.
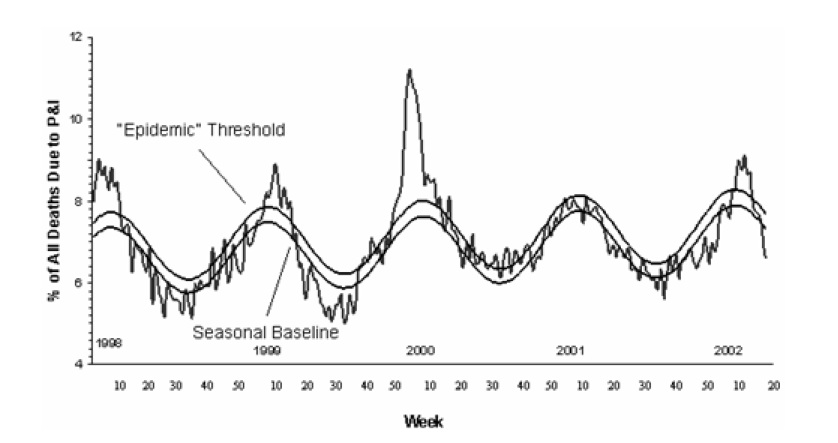
The picture says it all.

Further Reading: Automated Detection of Influenza Epidemics with Hidden Markov Models