Category: Statistics in the media
Most developers have never seen a successful project
Is this bad science? Since this is a retrospective study, there is non-random assignment for the treatment and control groups. That introduces selection bias. Projects that are more likely to implement a (long-winded) “waterfall” life-cycle approach are probably larger scale projects to begin with. Correlation is not causation. So, maybe it’s not the lifecycle approach that is the problem, but the confounding/lurking variable of project scale that is the problem. The study should control for the size of the project to make a valid conclusion about success rate of the development approach used. ie: Building a large insurance processing system will use a lifecycle approach, while building a fitness app will not. Apples to oranges, since one is much easier to be implement than the other.
At least they tried to control for 1 variable. They controlled for happiness level prior to the marriage, which has nothing to do with happiness while married. But, this study is still rubbish due to survivorship bias. People who are happy with their marriage will stay in the marriage. People who are unhappy may not stay in the marriage, and are not part of the study. To really measure if marriage causes happiness, you must run a controlled experiment and randomly assign people to a control and treatment group. The results of an observational study are invalid and meaningless. The article should conclude that “People who are in great marriages and decide to stay married …are happier than single people”
Incidentally, the article headline implies “Marriage makes you happy” Meanwhile, they later state the effect of living together makes you just as happy as legal marriage. So, they show that marriage has nothing to do with happiness, yet the headline states the exact opposite. Another case of a headline that the masses just accept at face value.
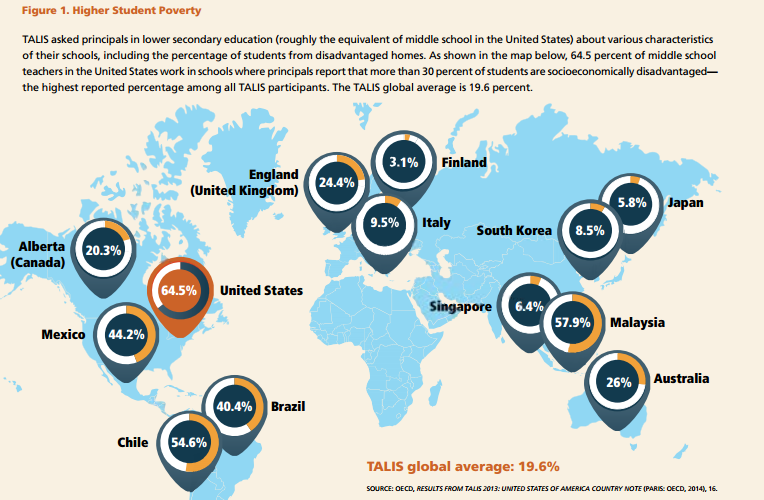
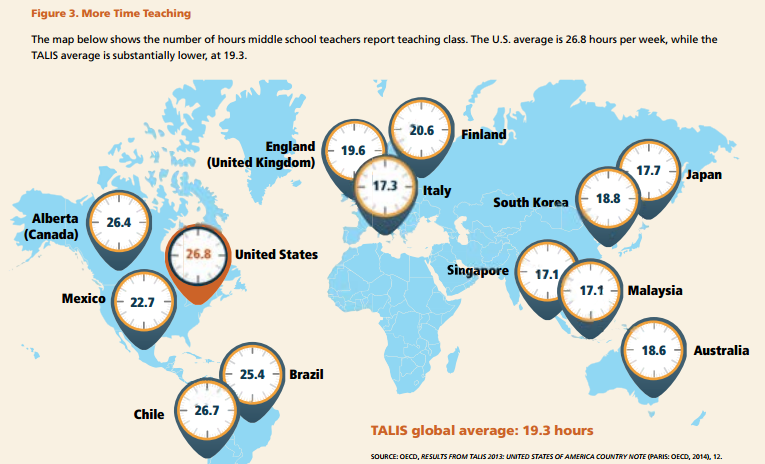
When comparing test scores of different countries, you need to control for variables. This is basic statistical illiteracy. Vastly different Student income and teacher workload are 2 factors are never mentioneds
Want to close the achievement gap? Close the teaching gap

Here is an example of selection bias. Correlation is not causation. Those with serious illness and poor health will not be in the active group. The limits of an observational study vs. a properly controlled experiment with random assignment.
Krueger and Dale studied what happened to students who were accepted at an Ivy or a similar institution, but chose instead to attend a less sexy, “moderately selective” school. It turned out that such students had, on average, the same income twenty years later as graduates of the elite colleges. Krueger and Dale found that for students bright enough to win admission to a top school, later income “varied little, no matter which type of college they attended.” In other words, the student, not the school, was responsible for the success.
http://www.brookings.edu/research/articles/2004/10/education-easterbrook
Misidentifying Factors Underlying Singapore’s High Test Scores
- Singapore’s student population does not include the children of huge numbers of people who work the lower-paying jobs in Singapore.
- For Singaporean students, school is their job; other activities are absent or relegated to minor roles.
- Most Singaporean children get additional schooling beyond the school day through individual tutoring or classes. (One survey found 97% of Singaporean students get private Math tutoring)
- China scores only include children from Shanghai. (How about we only include students from Scarsdale in the USA TIMMS scores?)
- Singapore schools do not contain any children from working class families (Service workers commute to Singapore from Malaysia). Singapore GDP is 50% higher than the USA’s.
- American students are involved with a wide array of sports and activities. 22% of American students have after school jobs.
- The reality is that top performing students in affluent suburbs of America perform on par with top performing countries who do not have lower class students in their results.
http://www.nytimes.com/2013/12/22/opinion/sunday/music-and-success.html
- Year after year, researchers report associations between children’s participation in music classes and better grades, higher SAT scores and elevated cognitive skills. It’s also well known that many successful adults played instruments as children. On the basis of such evidence, you might assume that music education helped cause such positive outcomes. That is a misguided assumption.
- Correlation does not imply causation. Parents who can afford private music lessons might also be more likely to read to their children than to sit them in front of the TV. Children willing to practice an instrument daily might also persevere longer than their peers on their math homework.
- The problem is that if you have collected a whole bunch of data and you don’t find anything or at least nothing really interesting and new, no journal is going to publish it.
- So if you, as a researcher, don’t find anything counterintuitive that disconfirms prevailing assumptions, you are usually not even going to bother writing it up.
Publication Bias (or, Why You Can’t Trust Any of the Research You Read)
Rod Carew, one of the few to make a serious run at .400 since Williams, has studied the .406 season and contends that Williams’s absences were a blessing.
“The fewer at-bats any hitter has over the required number of plate appearances, the better his chance is of hitting over .400,” Carew wrote in an e-mail responding to questions about 1941. “When I hit .388 in 1977, I had 694 plate appearances and 616 at-bats (239 hits). Ted had something like 450 at-bats in 1941 when he hit .406, and I think George Brett and Tony Gwynn had fewer then 450 at-bats when they made their runs at .400.
“All in all, the less at-bats, the better.”
He’s trying to articulate the Law of Large Numbers. Anyone hitting near .400 is deviating from the expected proportion of hits. If you flip a coin 10 times, you just might get 7 tails. If you flip if 1000 times, there’s no chance you’ll ever get 700 tails. Many people may bat .400 during a single game (a handful of at-bats), but almost no one does as the number of at-bats increases. Their average converges to the more realistic season average.
…97 percent of all Singaporean students, nearly 90 percent of South Korean primary students and about 85 percent of Hong Kong senior secondary students receive tutoring.
Tutoring Spreads Beyond Asia’s Wealthy
When comparing test scores of various countries, are they comparing similar samples? No. Just one (of many) confounding variable that needs to be controlled for is the amount of private tutoring each group of students receive.
Study Gauges Value of Technology in Schools
Mr. Pane conducted a study, financed by the federal Department of Education, of an algebra software program. He found that high school students who used the program …showed gains on their state-standardized math tests that were nearly double the gains of a typical year’s worth of growth using a more traditional high school math curriculum.
Double! Well, that sounds impressive. But, you want to know what exactly these “doubled gains” actually are. Does it mean a gain of 2 points instead of 1 point? Or does it mean 30 points instead of 15?
Note the last step in critically evaluating a study or experiment:
- The source of the research and of the funding.
- The researchers who had contact with the participants.
- The individuals or objects studied and how they were selected.
- The exact nature of the measurements made or questions asked.
- The setting in which the measurements were taken.
- Differences in the groups being compared, in addition to the factor of interest.
- The extent or size of any claimed effects or differences.
So, in light of #7, you should to read the actual study, and not a summarized interpretation in a newspaper. Here are some notable excerpts from the actual study:
- …treatment effect estimates are not significant the first year. The estimates are negative in the high school study and near zero in the middle school study.
- …the magnitude is sufficient to improve the average student’s performance by approximately eight percentile points. Consider a student who would score at the 50th percentile in the control group; an effect size of 0.20 is equivalent to having that student score at the 58th percentile if they were in the treatment group.
So, when you read the fine print, you learn that scores actually go down in the first year, and the improvement may not be as large you the article led you to believe.
The studies that Flegal did use included many samples of people who were chronically ill, current smokers and elderly, according to Hu. These factors are associated with weight loss and increased mortality.
Here is my favorite part of Leonard Mlodinow’s book “The Drunkard’s Walk: How Randomness Rules” Watch from 5:46
A 2006 study in The American Journal of Psychiatry, which looked at 32 head-to-head trials of atypicals, found that 90 percent of them came out positively for whichever company had designed and financed the trial. This startling result was not a matter of selective publication. The companies had simply designed the studies in a way that virtually ensured their own drugs would come out ahead—for instance, by dosing the competing drugs too low to be effective, or so high that they would produce damaging side effects. Much of this manipulation came from biased statistical analyses and rigged trial designs of such complexity that outside reviewers were unable to spot them. As Dr. Richard Smith, the former editor of the British Medical Journal, has pointed out, “The companies seem to get the results they want not by fiddling the results, which would be far too crude and possibly detectable by peer review, but rather by asking the ‘right’ questions.”

Here’s a quick summary of the challenges of implementing scientific method to test a supposed remedy:
The acid test, however, is in clinical trials, with human beings, and these are complicated. Basically, what you have to do is give a group of people a lot to drink, apply the remedy in question, and then, the next morning, score them on a number of measures in comparison with people who consumed the same amount of alcohol without the remedy. But there are many factors that you have to control for: the sex of the subjects; their general health; their family history; their past experience with alcohol; the type of alcohol you give them; the amount of food and water they consume before, during, and after; and the circumstances under which they drink, among other variables. (Wiese and his colleagues, in their prickly-pear experiment, provided music so that the subjects could dance, as at a party.) Ideally, there should also be a large sample—many subjects.
![]()
A FEW TOO MANY

But does eating together really make for better-adjusted kids? Or is it just that families that can pull off a regular dinner also tend to have other things (perhaps more money, or more time) that themselves improve child well-being?
Is the Family Dinner Overrated?


