The Wallaby That Roared Across the Wine Industry
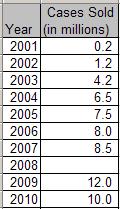
By the end of 2001, 225,000 cases of Yellow Tail had been sold to retailers. In 2002, 1.2 million cases were sold. The figure climbed to 4.2 million in 2003 — including a million in October alone — and to 6.5 million in 2004. And, last year, sales surpassed 7.5 million — all for a wine that no one had heard of just five years earlier.
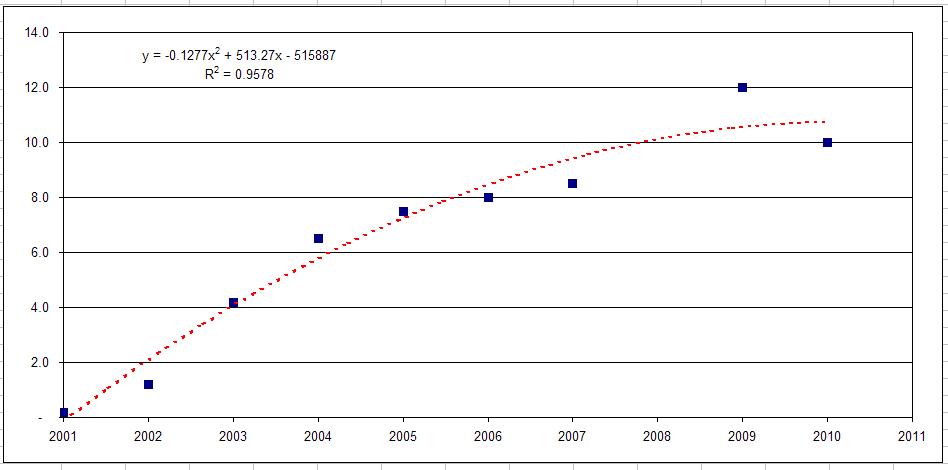
Prima facie, it looks like exponential growth. But, in the real world, nothing ever grows exponentially in perpetuity (except college tuition, it seems) I looked up sales figures for other years online. Let’s plot these numbers in a spreadsheet, and see how they look. As you can see the growth started to flatten out after a few years. 
Do you notice the negative leading coefficient of the x2 term? Remember how this makes the parabola “frown”? Well, this “inverted parabola” shape clearly reflects the flattening of the sales growth.
By just looking at the trendline,what’s your estimate for the number of cases sold in 2008? Or, plug 2008 into the equation to get the exact coordinates on the red trendline: \(f(2008) = -.13(2008)^2 + 513(2008) – 515887 \)
