Categories
Education Statistics

Correlation between student grades in Algebra2 vs. Trig

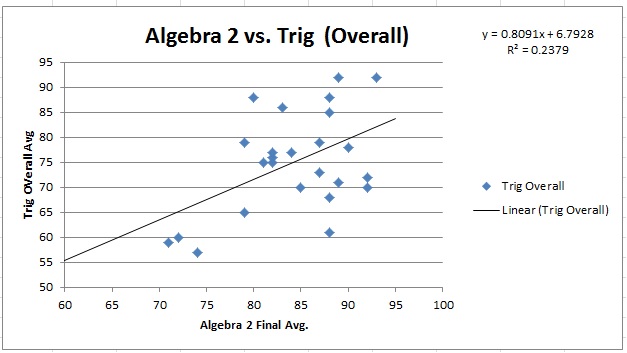
I wanted to examine the correlation between a student’s performance in Algebra 2 and his subsequent performance in Trigonometry.  This provides an opportunity to see if our past course recommendations were sound.  (In this case, the decision to place a student from Algebra 2 into either Trig or a more remedial Math course)   I felt this data might be useful in determining a cut-off score for promotion into the next course.  ie:  Is there a grade threshold in the 1st course that is associated with failure in the 2nd course?

Results:  It’s a small sample size (n=25), but the 3 students who scored under 75 (overall) in Algebra 2 ended up failing Trigonometry.  The r-squared was .24, which can be interpreted as saying that 49% of the variation in the Trig grades were explained by the Algebra 2 grades.

Categories
Statistics

The Wallaby That Roared Across the Wine Industry

The Wallaby That Roared Across the Wine Industry

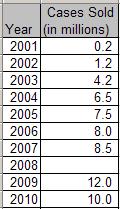
By the end of 2001, 225,000 cases of Yellow Tail had been sold to retailers. In 2002, 1.2 million cases were sold. The figure climbed to 4.2 million in 2003 — including a million in October alone — and to 6.5 million in 2004. And, last year, sales surpassed 7.5 million — all for a wine that no one had heard of just five years earlier.

Prima facie, it looks like exponential growth.  But, in the real world, nothing ever grows exponentially in perpetuity (except college tuition, it seems)   I looked up sales figures for other years online.  Let’s plot these numbers in a spreadsheet, and see how they look.  As you can see the growth started to flatten out after a few years. I actually couldn’t find the sales data for 2008, so this calls for a statistical regression (fancy words for “line of best fit”).  A linear regression only yielded r=.88, while a 2nd degree polynomial (quadratic) regression gave an r = .96.  This regression equation is \(f(x) = -.13x^2 + 513x – 515887\)
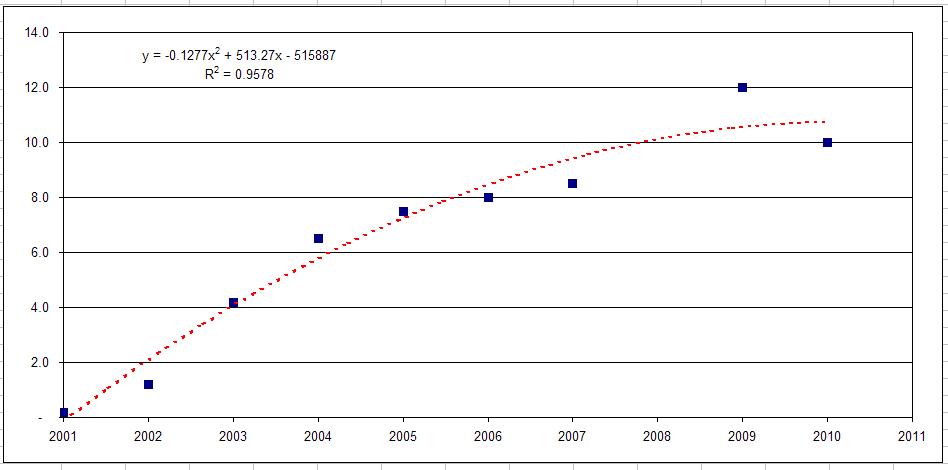

Do you notice the negative leading coefficient of the x2 term? Remember how this makes the parabola “frown”?  Well, this “inverted parabola” shape clearly reflects the flattening of the sales growth.  

By just looking at the trendline,what’s your estimate for the number of cases sold in 2008? Or, plug 2008 into the equation to get the exact coordinates on the red trendline:  \(f(2008) = -.13(2008)^2 + 513(2008) – 515887 \)


Categories
Algorithms Computer Programming Statistics

How does Netflix predict which movies you’ll like best?

The simplest way to predict your rating for a movie is simply to average everyone else’s rating of the movie.  (ie:  They can just give you the 10 movies with the highest average rating)  Of course, it can get much more complex that than, especially when NFLX was giving away a million dollars to anyone who could improve their rating algorithm!  The real meta of this problem is to determine other people who are most like you, and then use their collective ratings on movies you haven’t seen yet.

Neighborhood-based model (k-NN): The general idea is “other people who rated X similarly to you… also liked Y”.  To predict if John will like “Toxic Avenger”, first you take each of John’s existing movie ratings, and for each one (eg: “Rocky”), find the people who rated both “Rocky” & “Toxic Avenger”.  You then compare the ratings given to both movies by these people, and calculate how correlated these 2 movies are.  If it’s a strong correlation between their ratings, then “Rocky” is a strong neighbor in predicting John’s rating for “Toxic Avenger”.  You’ll weigh in the average rating given (by “Rocky raters”) to “Toxic Avenger” highly.  You do this for all the movies that John has already rated, and find each one’s strongest neighbor(s), and calculated a predicted “Rocky” rating from each movie John has already rated.  You then calculate a weighted average of all these predictions to come up with your ultimate prediction for John’s rating of “Rocky”.  Lastly, if you do this for every movie in the entire database, you can determine a “Top 10 suggestions” list for John.


Here is some general reading on the contest:

The BellKor solution to the Netflix Prize

This Psychologist Might Outsmart the Math Brains Competing for the Netflix Prize

The Netflix Prize: 300 Days Later

The Greater Collaborative Filtering Groupthink: KNN