What an absolutely brilliant application of geometry!
Author: admin
Here is my favorite part of Leonard Mlodinow’s book “The Drunkard’s Walk: How Randomness Rules” Watch from 5:46

The 2 best rated techniques were:
Practice testing – Self-testing or taking practice tests on to-be-learned material.
Distributed practice – Implementing a schedule of practice that spreads out study activities over time, versus being massed in a short period of time
Low utility: Summarization, highlighting, the keyword mnemonic, imagery use for text learning, and rereading.
Moderate utility: elaborative interrogation, self-explanation, and interleaved practice.
Highly effective: Practice testing and distributed practice.
Explanation of the 10 study techniques
Improving Students’ Learning With Effective Learning Techniques
The Math of Y2K

Airplanes crashing! ATM machines stopping! Computers exploding!? What was the Y2K doomsday all about?
Most computer programs written prior to the mid 1990s used only 2 characters to keep track of the year. Back in the 1970s and 1980s, computing power was expensive, so it made sense not to waste 2 extra digits storing a bunch of redundant “19__” prefixes. The computer would simply store a 55 or 97, instead of 1955 or 1997.
The problem with Y2K was that any date calculation written this way would fail once the year rolled over to 2000. Why? Let’s look at a very simple example. Let’s say a computer program calculates how old you are in order to determine if you’re eligible for certain medical benefits. The code could look something like this:
birth_year = 29;
current_year = 95;
age = current_year – birth_year;
If (age >= 65) then medicare_eligible = TRUE;
Normally, this works fine. In the above example, the age = 95 – 29 = 66, and he can get medicare benefits. But, notice what happens when this same code runs in the year 2000 !
birth_year = 29;
current_year = 00;
age = current_year – birth_year;
If (age >= 65) then medicare_eligible = TRUE;
Now age = 00 – 29. That’s negative 29 years old. Clearly, -29 is not greater than 65. So, the computer thinks you’re not old enough to get medicare benefits! The logic goes haywire unless all the date codes are expanded to 4 digits. Once you do that, 2000 – 1929 = 71.
Apply this simple calculation error to anything that needed to compare dates, or determine how old something is, or how much time has passed. This is why people were expecting a computing catastrophe when the date rolled over.
A 2006 study in The American Journal of Psychiatry, which looked at 32 head-to-head trials of atypicals, found that 90 percent of them came out positively for whichever company had designed and financed the trial. This startling result was not a matter of selective publication. The companies had simply designed the studies in a way that virtually ensured their own drugs would come out ahead—for instance, by dosing the competing drugs too low to be effective, or so high that they would produce damaging side effects. Much of this manipulation came from biased statistical analyses and rigged trial designs of such complexity that outside reviewers were unable to spot them. As Dr. Richard Smith, the former editor of the British Medical Journal, has pointed out, “The companies seem to get the results they want not by fiddling the results, which would be far too crude and possibly detectable by peer review, but rather by asking the ‘right’ questions.”

Here’s a quick summary of the challenges of implementing scientific method to test a supposed remedy:
The acid test, however, is in clinical trials, with human beings, and these are complicated. Basically, what you have to do is give a group of people a lot to drink, apply the remedy in question, and then, the next morning, score them on a number of measures in comparison with people who consumed the same amount of alcohol without the remedy. But there are many factors that you have to control for: the sex of the subjects; their general health; their family history; their past experience with alcohol; the type of alcohol you give them; the amount of food and water they consume before, during, and after; and the circumstances under which they drink, among other variables. (Wiese and his colleagues, in their prickly-pear experiment, provided music so that the subjects could dance, as at a party.) Ideally, there should also be a large sample—many subjects.
![]()
A FEW TOO MANY

But does eating together really make for better-adjusted kids? Or is it just that families that can pull off a regular dinner also tend to have other things (perhaps more money, or more time) that themselves improve child well-being?
Is the Family Dinner Overrated?
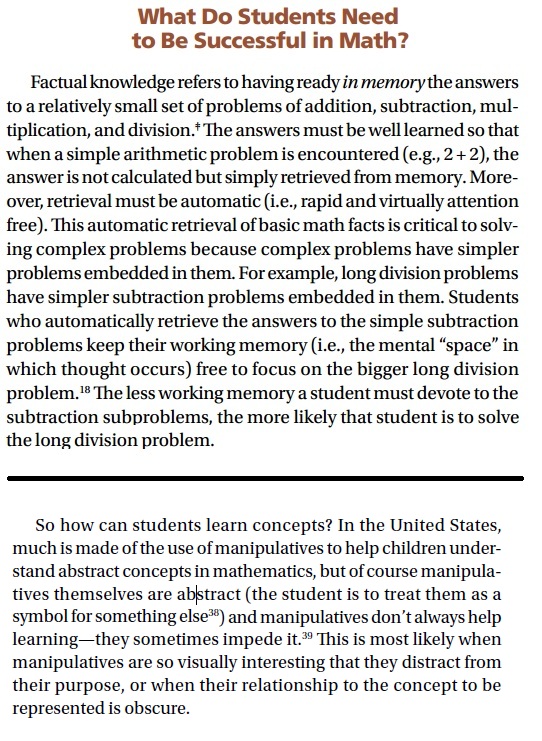
Excerpted from Is It True That Some People Just Can’t Do Math?
The Case For Fully Guided Instruction
- Decades of research clearly demonstrates that when teaching new information or skills, step-by-step instruction with full explanations works best.
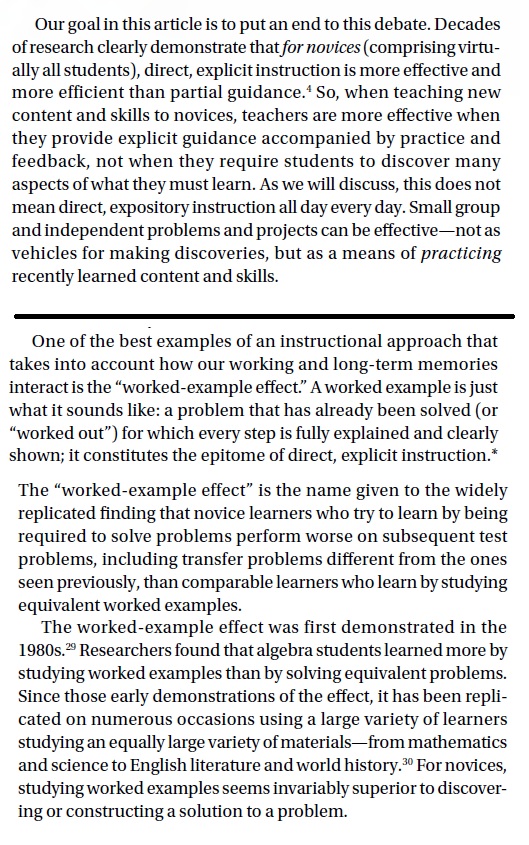
- For novices, studying “worked examples” seems invariably superior to discovering or constructing a solution to a problem.
Power Steering Fluid

I was replacing the power steering fluid in my car when I stumbled upon some exponential decay math. First, some background: There is no drain plug on a power steering system. You need to siphon out fluid from the reservoir and replace it with new fluid. This new fluid then mixes into the rest of the system to create a slightly cleaner mixture. This idea is that if you repeat this a few times, you’ll replace most of the old fluid with new fluid.
So, as you can see, there exists some sort of formula that can determine exactly how many times you need to extract and replace to reach X% replacement.
My car’s entire power steering system holds about 1 liter, and the reservoir itself holds .4 liters of that. So, 40% of the steering fluid is replaced each time I drain and refill the reservoir, and 60% of the old fluid remains elsewhere in the system. I can do this repeatedly, each time replacing 40% of the “mixed” fluid with brand new fluid.
Let p = Percentage of the system replaced each time you empty the reservoir.
Let n = number of times you empty/fill the reservoir (“flush”)
Let FD = Percentage of dirty fluid in the system.
Let FN = Percentage of new fluid in the system.
If p = percentage of new fluid introduced by a flush, then (1-p) is percentage of old fluid remaining. (eg: if \(p = .40, then (1-.40) = .60)\)
\(FD_0 = 1\) (initial proportion that is dirty)
\(FD_1 = (1-p)\)
\(FD_2 = (FD_1)(1-p) = (1-p)(1-p)\)
\(FD_3 = (FD_2)(1-p) = (1-p)(1-p)(1-p)\)
…
\(FD_n = (FD_{n-1})(1-p) = (1-p)^n\)
\(FD = (1-p)^n\)
\(FN = 1 – FD\)
For my car, p=.40 so \(FD = (1-.40)^n\)
How many times do I need to empty and fill the reservoir to get to 80% clean?
Just set \(FN = .8\) and solve for n:
\(.80 = 1- (1-.40)^n\)
\(.80 = 1- (.60)^n\)
\(.6^n = .2\)
\(log(.6)^n = log(.2)\)
\(n*log(.6) = log(.2)\)
\(n = \frac{log(.2)}{log(.6)}\)
\(n = 3.15\)
With a reservoir that holds 40% of capacity, I need to empty and replace it about 3 times to get 80% of the old fluid replaced.
You can also use the formula to figure out what percentage of the system contains old vs. new fluid, based on the number of flushes you’ve done. For this, you just plug in n and calculate \(FD\) eg: If you’ve done 5 flushes, \(FD = (1-.4)^5 = .08\) So, after 7 refills, 8% is dirty, and 92% is new.
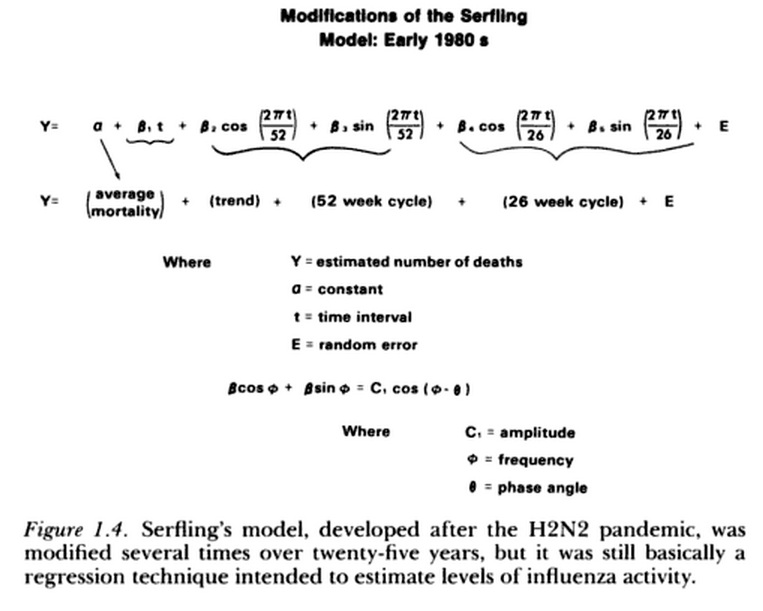

In a nutshell, the sin() and cos() terms are periodic curves, and the weighting of the various coefficients is what allows proper regression fits. Let’s take a closer look at the formula, and try to make sense of it.
For example, as t goes from 0 to 52, \(\frac{t}{52}\) goes from 0 to 1, \(2\pi * \frac{t}{52}\) goes from 0 and 360. (and then it repeats since sin repeats in multiples of \(2\pi\) and therefore \(sin(2\pi * \frac{t}{52})\) goes from sin(0) to sin(360) which is a full periodic cycle of this function. Note the same logic applies to the cos() term in the formula.
The picture says it all.
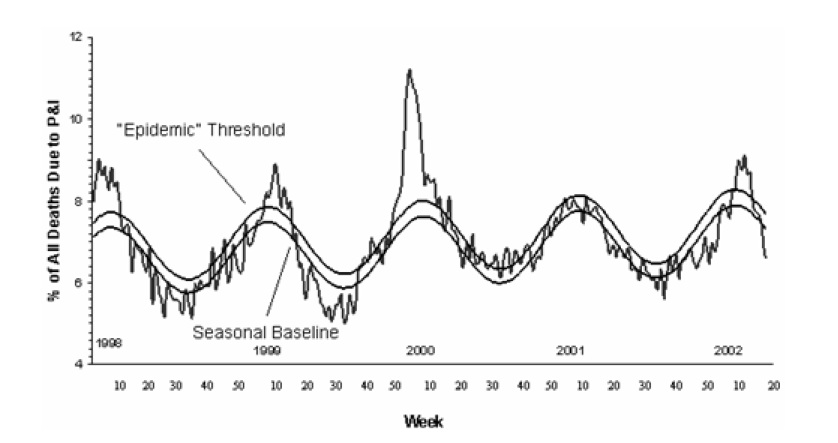
Further Reading: Automated Detection of Influenza Epidemics with Hidden Markov Models
A study of 396 ultramarathoners found that while many suffer injuries throughout the course of their race, the vast majority of them are minor. Researchers looked at medical data on runners who competed in Racing the Planet 4 Deserts series, a four-part ultra-race that takes place over seven days in rough terrain on four continents. Runners travel 150 miles per race.
What group of people is this study excluding? Right, all the people who got injured training, and all the people who have quit running. To really make the point, it also does not include people who possibly died from running. This is a blatantly flawed study.
Ultramarathoners suffer injuries but most may be minor, a study finds

They appear, for example, to focus more critically on the earnings potential of prospective mates. Because house size is often assumed to be a reliable signal of wealth, a family can enhance its son’s marriage prospects by spending a larger fraction of its income on housing.
For example, when Shang-Jin Wei, an economist at Columbia University, and Xiaobo Zhang of the International Food Policy Research Institute examined the size distribution of Chinese homes, they found that families with sons built houses that were significantly larger than those built by families with daughters, even after controlling for family income and other factors. They also generally found that the higher a city’s male-to-female ratio, the bigger the average house size of families that have sons.
Mr. Wei reports that many families with sons have begun to add a phantom third story to their homes, one that looks normal from the outside but whose interior space remains completely unfinished.
“Marriage brokers are familiar with the tactic,” he reports, “yet many refuse to schedule meetings with a family’s son unless the family house has three stories.”

The essence of fractal geometry lies in recursive iteration. What’s that? It’s just a self-referring loop. Let’s start with a simple equation: \(f(x)=2x+1\)
Let x=0 and plug it in, and you’ll get a 1:
\(f(0)=2(0)+1=1\)
(Now, take that 1 and plug it back into the same equation)
\(f(1)=2(1)+1=2\) (Then, take this 2 and do the same thing)
\(f(2)=2(2)+1=5\)
\(f(5)=2(5)+1=11\)
\(f(11)=2(11)+1=23\)
And so forth. You can keep doing this forever, and notice how this list of results (0,1,2,5,11,…) will tend towards infinity (This isn’t always the case)
The mother of all fractals, the Mandelbrot Set is defined by this deceptively simple equation: \(f(z)=z^2+c\) where c is some fixed constant. If you do the same procedure above, you’ll get a series of numbers. eg: Let c=5, and let’s start with z=0:
\(f(0)=0^2+5=5\)
\(f(5)=5^2+5=30\)
\(f(30)=30^2+5=905\)
At IBM, Benoit Mandelbrot used a complex number (a+bi) for that constant. For example, let’s use \(c=1+i\), as he did in his 1980 Scientific American article introducing fractals:
\(f(0)=0^2+(1+i)=1+i\)
\(f(1+i)=(1+i)^2+(1+i)=(1+i)(1+i)+(1+i)=(1+2i+i^2)+(1+i)=2i+(1+i)=1+3i\)
\(f(1+3i)=(1+3i)^2+(1+i)=(1+3i)(1+3i)+(1+i)=(1+6i+9i^2)+(1+i)=6i-8+(1+i)=-7+7i\)
…and so on. For the Mandelbrot set, the calculation is iterated until it’s clear whether the result is tending towards 0 or infinity. Based on this result, for every complex number, you plot a point on the complex plane either black or white. (Or, it is colored based on how fast it tends towards infinity.) For example, 1+i tends towards infinity when plugged into this equation, so a black point is plotted for 1+i on the complex plane. This process was then repeated for every complex number, and was only possible because of the advent of modern computers. Every single complex number gets a point (eg: .234234234 + .324325423i) The result is the deeply infinite, self-referential image you see above. The image is much more complex than it appears. For example, if you zoom in to a certain section, you will see the entire image repeat within itself, and then repeat within that zoom! I can’t do it justice here, so if you want to learn how this Math models real life phenomena & situations, these 2 videos are a great primer for a layman:

Silicon Valley School That Doesn’t Compute
- Not a computer to be found. No screens at all. They are not allowed in the classroom, and the school even frowns on their use at home.
- And where advocates for stocking classrooms with technology say children need computer time to compete in the modern world, Waldorf parents counter: what’s the rush, given how easy it is to pick up those skills? “It’s supereasy. It’s like learning to use toothpaste,” Mr. Eagle said. “At Google and all these places, we make technology as brain-dead easy to use as possible. There’s no reason why kids can’t figure it out when they get older.”
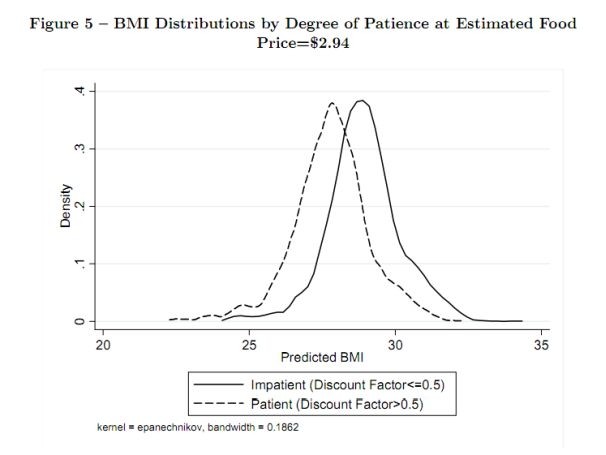
Here is a good example of having to control for variables, in an attempt to best isolate the 2 factors being compared.
They controlled for other factors that might come into play, such as demographics and financial characteristics.
With everything else held constant, the researchers found that impatient individuals are more likely to be obese than people who are good at waiting. “We controlled for basically every variable in the kitchen sink,” says Courtemanche, the lead author and a professor at the University of Louisville. “It seems if you genuinely hold all else constant, the more patient you are, the less you weigh.”
Animating the scatterplot adds a 3rd dimension: Time. Also, his commentary reminds me of a horseracing announcer!
- Studies have found that roughly 40 percent of students planning engineering and science majors end up switching to other subjects or failing to get any degree.
- Professors also say they are strict because science and engineering courses build on one another, and a student who fails to absorb the key lessons in one class will flounder in the next.

- By concentrating on what, and leaving out the why, mathematics is reduced to an empty shell.
- But if your Math teacher gives you the impression that mathematics is about formulas and definitions, and memorizing algorithms, who will set you straight?
- …after being told they were “good at math”, that in fact they have no real mathematical talent and are just very good at following directions.
- Mathematics should be taught as art for art’s sake.
- School boards do not understand what mathematics is; neither do educators, textbook authors, publishing companies, and sadly, neither do most of our math teachers.
- Attempts to present mathematics as relevant to daily life inevitably appear forced and contrived…People enjoy fantasy, and that’s just what math can provide. An anodyne to the practical workday world.
- Circles: Which is more interesting, using a formula someone handed you without explanation, or hearing the story of one of the most beautiful, fascinating problems, and one of the most brilliant and powerful ideas in human history?
- So put away your lesson plans and overhead projectors, your full-color textbook abominations, your CD-ROMs and the whole rest of the traveling circus freak show of contemporary education, and simply do mathematics with the students!
- Would you accept as an art teacher someone who has never picked up a pencil or stepped foot in a museum? Why is it that we accept math teachers who have never produced an original piece of mathematics, …nothing in fact beyond what they are expected to present to their unfortunate students? What kind of a teacher is that? How can someone teach something that they themselves don’t do?
- It may be true that you have to be able to read in order to fill out forms at the DMV, but that’s not why we teach children to read.


